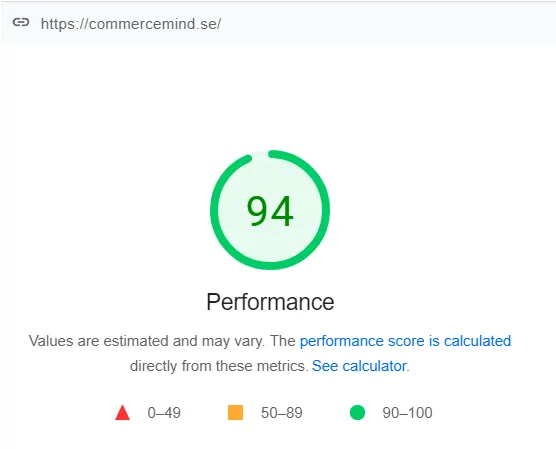
That high performance on an e-commerce site is important is nothing new, and Google has long indicated that your performance is taken into account for how well you rank in search results. But before the summer of 2021, the only thing proved to matter a lot was if you had really bad performance. If you had a TTFB (that is, how long it takes before your server gives any response at all) of several seconds, that penalised you in ranking. In reality no e-commerce operator has been affected by this, because if you have a TTFB of several seconds, no one will want to shop with you anyway.
Web Vitals
What has changed is that Google introduced Core Web Vitals which is a set of metrics they have defined. How well your site performs on these metrics is now a factor in how well you rank. There are more metrics than the three below, but it is only the grade on these three that Google weighs into your ranking. Other metrics like FCP (First Contentful Paint) are primarily interesting to work with because they can help you improve the metrics below.
Largest Contentful Paint (LCP)
LCP is a measurement of how long it takes before the largest area has been drawn on screen. This is usually images on an e-commerce site. It is important to think about that the image, video or text block that counts as LCP can change while the site loads. If you have an image that loads fast and then a larger image that loads more slowly, the slow image will count as your LCP.
A good start for identifying LCP problems is to turn off JavaScript in your browser and go to your site to see how it looks before JavaScript has loaded. The point is not that the site has to work without JavaScript, but that it is common for sites not to be fully finished until all JavaScript has run. If you, for example, notice that no images appear when you have turned off JavaScript, there is a big potential for improvement, because images are usually what counts as LCP.
Or that you show product recommendations high up that are loaded via a script. Changing it so recommendations appear earlier can be hard depending on which recommendation service you use. The easiest way to handle it is then to move the recommendations down below content you can show faster.
LCP should happen within 2.5 seconds, and that is what is required to get a passing grade according to Core Web Vitals.
First Input Delay (FID)
LCP is a bit easier to understand without getting into tech, while FID is harder. When a customer comes to the site, they want to start interacting as fast as possible, and FID is how long it takes from the user clicking on something to the browser managing to act. That delay is because the browser is busy with everything happening as the site loads, and you want that delay to be as short as possible.
The absolute biggest culprit for delay is the amount of JavaScript you use. Here you want to delay loading of scripts as much as possible. You probably load large amounts of scripts that do not necessarily have to be run immediately. If you can, for example, wait until after the user has started interacting (clicked, scrolled etc.) to load certain scripts, you can gain a lot on these metrics.
FID should be less than 100 milliseconds to get a passing grade.
Cumulative Layout Shift (CLS)
CLS is a way to measure how much things jump around while the page is loading. A classic example of when things jump is that you want to show an image at the top, but the image does not take up space in advance; when the image has loaded, it appears and pushes the content underneath down. Another example is that you use fonts not built into the browser, and when the font has loaded, the size of the text changes, causing a jump. Perhaps the most common example is when something renders only after JavaScript has run, and that rendering causes a jump.
To improve your CLS you should primarily make sure that images do not cause jumpiness when they load, and that you do not use scripts to show content within the first screen, since that causes jumpiness between the page first loading and your scripts being loaded and run.
CLS is measured in a way that is not entirely easy to understand, and you should have 0.1 or less to be passing. The point is simply not to have any jumps at all.
How do PageSpeed and Core Web Vitals affect my ranking?
A very common misconception is that it is the grade between 0 and 100 shown on PageSpeed Insights that determines how your performance affects the ranking, but that is not the case. The grade you get there is that Google's test servers do so-called lab measurement. A test server will visit the site you specify and make a measurement, and it is done with hardware and network that probably do not represent your real customers. That measurement is also as if it is the first time that device is visiting the site, so no cookies are set and no images have been loaded before, which quite often gives significantly worse performance than for a returning visitor. Not least because of cookie banners, which we all love to hate. How much you are penalised by a cookie banner depends on how many first-time and rare visitors you have.
What the ranking is instead affected by is so-called Field Data. That is, data your real customers have reported in anonymously to Google by having consented to Google Chrome sending in Field Data. The customers who report in are only those using Chrome. And the metrics used in your rating are only LCP, FID and CLS.
To achieve optimal ranking you have to get a passing grade on all three metrics. Importantly, Google has announced that they treat all pages with passing grades the same. Once you have achieved a passing grade, the important thing is to maintain that passing grade and (at least from a Google perspective) uninteresting to get even better numbers on the three metrics.
Another important thing to think about is that each page/URL is measured individually. Your grade on the homepage and a product page is probably not at all the same. And different product pages can also have completely different grades depending on their content. Different products with you can thus be penalised or boosted depending on how you have designed the product page.
You can see how your site is performing for real customers by making a measurement on PageSpeed Insights. In the first section that says "Discover what your real users are experiencing" you see how well your site is performing for your real customers (using Chrome).
In this section you see data for the specific page you measured, but you can also click on the "Origin" tab above to get an average of how well all your pages are performing. Which pages and page types you should prioritise depends entirely on what your most common landing pages from Google are. Improving performance on pages that you typically do not find from Google is of course good anyway, but will not affect your ranking.
You can also see significantly more granular information in your Google Search Console under Core Web Vitals.
Can I ignore the PageSpeed grade?
No, you cannot, but if your PageSpeed grade is 10 out of 100 while your Field Data says you are reasonably close to where you should be, you can take the PageSpeed grade with a pinch of salt. It is, for example, far from uncommon to see LCP in Field Data reported as under five seconds while LCP for Lab Data is over 20 seconds. What those differences depend on is different for different sites, but often it is connected with cookie banners and Google's test servers running with intentionally worse hardware than your customers do.
The PageSpeed grade is primarily interesting to look at based on how it changes over time rather than the number itself. If your grade drops from 50 to 10, then probably the experience for your real customers has also become worse. But it is entirely possible to have a low PageSpeed grade and still have a passing grade in Field Data. Curiously enough, it is surprisingly many sites that can get 100 out of 100 in grade but still do not have a passing grade in Field Data.
Because your Field Data is an average of the last 28 days of reported data, PageSpeed also becomes an easier tool to work with day to day. If you do improvement work, it will take at least 28 days before you see the effect in your Field Data, while Lab Data will give a direct answer. Because there is often such a big difference between Field Data and Lab Data, you should both work with the official PageSpeed tool and use Lighthouse measurements in Chrome's DevTools to measure on your or your developers' computer. With local tests it is easier to get closer to what your real customers experience, and easier to test continuously in connection with changes being made.
What can I do to get a passing grade in Web Vitals?
There are (usually) no shortcuts to the perfect grade. Often there is some low-hanging fruit with how images and scripts are loaded, but to consistently get passing grades on all three metrics requires analysis and continuous improvement work. You probably need to contact an expert to get help leading the work and identifying what you need to focus on. And perhaps most importantly, getting a culture of performance focus into daily life.